

Team Coaching ROI: What You Can Measure, What You Cannot, and a Framework That Works
How do you measure team coaching ROI?
Use a five-step framework: baseline leading and lagging indicators before the engagement starts, define what improvement justifies the investment, track behavioral changes monthly, track performance outcomes quarterly using existing organizational instruments, and run a retrospective with the team at engagement end. Three data levels matter: satisfaction, behavioral, and performance outcome data.
Most team coaching ROI statistics you will find online are unreliable. The two most cited numbers come from studies that measured individual executive coaching, relied on self-reported data, and had no control groups. Applying them to team coaching is not imprecise. It is misleading.
This article separates what organizations can actually measure from what they cannot, provides a five-step measurement framework and a scorecard built on leading and lagging indicators, and names the attribution problems any team coaching ROI claim has to account for.
Key Takeaways
- The 788% and 7x coaching ROI statistics come from individual coaching studies with no control groups. Do not apply them to team coaching
- Leading indicators (decision velocity, decision quality, meeting effectiveness, participation balance) change within weeks and provide early evidence of coaching impact
- Lagging indicators (retention, engagement, delivery metrics) take 6–12 months and carry attribution caveats
- A five-step measurement framework (baseline, define enough, track monthly, track quarterly, retrospective) and a one-page scorecard structure the ROI conversation around observable evidence
- Satisfaction surveys measure comfort, not effectiveness. Supplement them with behavioral and performance data
The ROI Problem in Coaching
Measuring team coaching return on investment is structurally difficult because four problems compound simultaneously: the counterfactual, the attribution gap, the time lag, and the measurement paradox. No methodology eliminates all four, but naming them allows organizations to build frameworks that account for uncertainty rather than pretending it does not exist.
The counterfactual problem. Organizations cannot observe what would have happened without coaching. A team that improves after a coaching engagement may have improved anyway due to a new leader, a market shift, or simple regression to the mean. Without a control group receiving no coaching under identical conditions, isolating the coaching variable is impossible in most organizational settings.
The attribution problem. Team performance is influenced by dozens of variables: leadership changes, restructuring, market conditions, new tools, hiring decisions. Attributing a measurable business outcome solely to coaching overstates what any single intervention can claim.
The lag problem. Behavioral change is observable within weeks. Performance impact takes months. The metrics that matter most to a CFO operate on quarterly or annual cycles, long after the coaching engagement has ended. By the time lagging indicators move, the causal connection to coaching has weakened.
The measurement paradox. The outcomes organizations value most from coaching (trust, decision quality, the capacity to handle conflict productively) are the hardest to put a dollar figure on. The outcomes easiest to measure (satisfaction scores, attendance) say the least about impact. Decision quality is the partial exception: it resists a dollar value, but it leaves observable traces in how a team decides, which is why it appears below as a leading indicator.
Two statistics dominate coaching ROI articles. The 788% figure comes from MetrixGlobal’s 2001 executive briefing on a coaching program at one Fortune 500 telecommunications company. Of 43 leadership development participants, mostly middle managers, 30 returned a questionnaire and then estimated the financial benefits of their coaching in telephone interviews. The briefing reports a 529% return without the benefit of improved retention and 788% with it, and it describes no comparison group. The 7x figure comes from the International Coaching Federation (ICF), which commissioned the 2009 ICF Global Coaching Client Study from PricewaterhouseCoopers and Association Resource Centre: an online survey of 2,165 coaching clients in 64 countries, in which companies reported a median return of seven times their investment and individual clients 3.44 times.
Both figures rest on the estimates of people who had already chosen coaching, and neither study measured team coaching. Quoting them as evidence for team coaching ROI puts a number in front of procurement teams and CFOs that will not survive a look at the source. Both studies, with their methodology notes, appear in our coaching industry statistics, and the evidence on individual coaching is weighed in our analysis of whether executive coaching is worth it. For a team, the work starts with deciding what to measure and when.
Leading Indicators: What Changes First
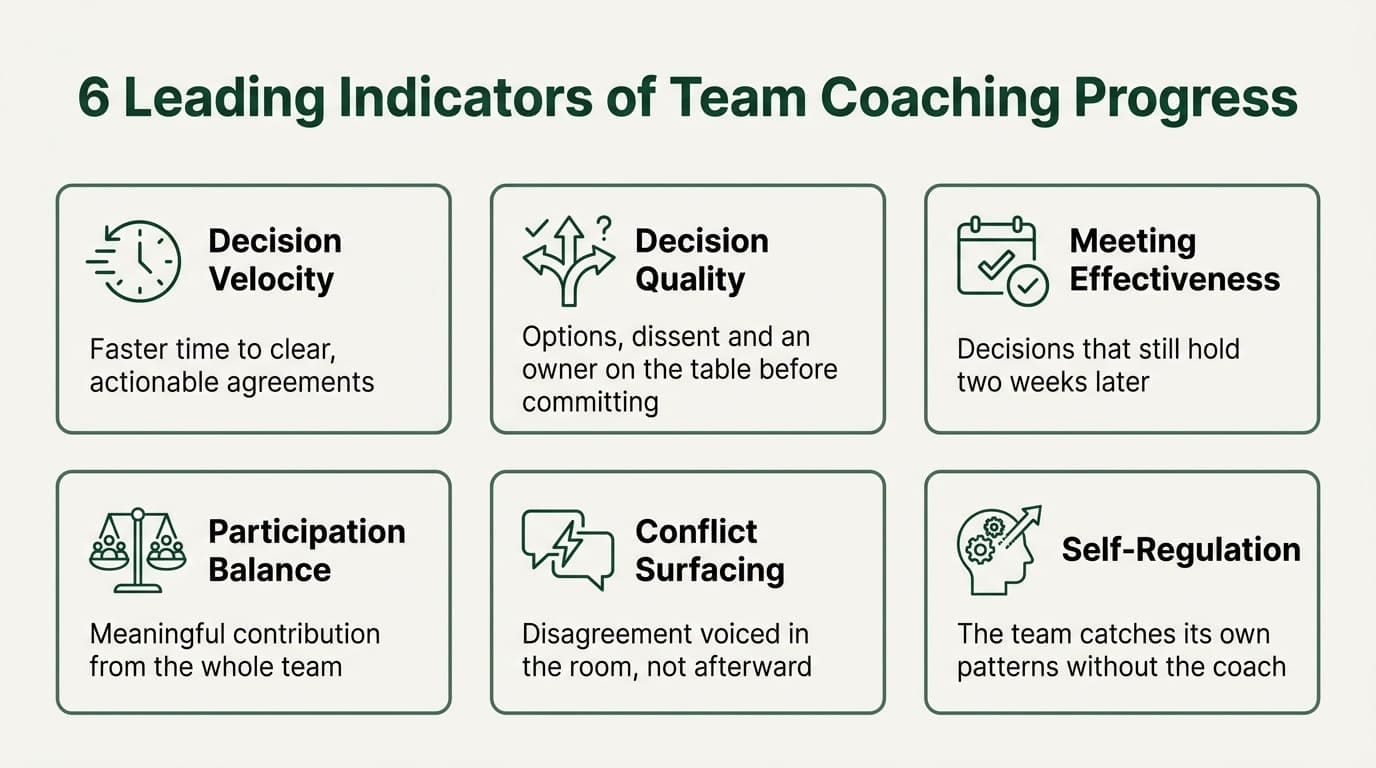
Leading indicators are behavioral changes observable within weeks of a coaching engagement. They do not require quarterly data cycles or organizational surveys. They are visible in meetings, decisions, and team interactions, and they provide the earliest signal that coaching is producing change in collective performance.
Decision velocity. The time between a team discussing an issue and committing to action. Before coaching, decisions often span multiple meetings: discussed Monday, revisited Wednesday, deferred to next week. Track the gap between discussion and commitment meeting-over-meeting. Improvement looks like decisions resolving in the meeting where they surface.
Decision quality. Velocity has a blind spot: a team can get faster and worse at the same time. Decision quality is the counterweight. Decision-quality frameworks judge a decision by how it was made rather than by how it turned out, because outcomes also depend on things the team did not control. Strategic Decisions Group’s framework names six elements: the right frame, real alternatives, meaningful information, clear values and trade-offs, sound reasoning, and commitment to action. Each has a visible team behavior. The problem gets framed before solutions are argued. More than one option reaches the table. People say what they do not know. Trade-offs are stated out loud. Dissent is voiced in the room before the team commits, rather than afterward. The decision leaves the meeting with an owner and a next action. Amy Edmondson’s study of 51 work teams linked team psychological safety, a shared belief that the team is safe for interpersonal risk taking, to the team’s learning behavior, which is why dissent voiced early counts as progress.
Track decision quality with a decision log: for each significant decision, the date, the options considered, the owner, the next action, and a review date. Review the log in the monthly check-in. A decision held if it was not reopened without new information and is being carried out. Reopening a decision because new information arrived is good practice, so the log records why. Read velocity and quality together. If time to decision falls while the share of decisions that hold also falls, the team is deciding faster without deciding better. Decision quality is a judgment the team makes about its own decisions, so treat it as material for the team’s review rather than a score to maximize.
A team that decides faster but reopens more of its decisions has only moved the work to later meetings.
Meeting effectiveness. Measured not by how people feel about meetings but by whether decisions stick. A team that makes a decision on Tuesday and revisits it on Thursday has a meeting effectiveness problem that coaching directly addresses. Track decisions made versus decisions that hold across a two-week window.
Participation balance. In most teams, two or three members do most of the talking. Coaching shifts that balance. Track speaking distribution across team conversations. Improvement is not equal airtime but meaningful contribution from members who previously defaulted to silence.
Conflict surfacing. Teams that begin naming disagreements rather than avoiding them are progressing, even though the surface behavior may look more contentious. Before coaching, disagreement goes underground and emerges as passive resistance. After coaching, disagreement enters the room. This is a positive leading indicator, though it can alarm sponsors who expect coaching to reduce visible conflict.
Self-regulation. The clearest sign of coaching effectiveness is when the team begins facilitating its own conversations without the coach prompting. The team catches its own patterns: "We are doing the thing again where two people decide and everyone else checks out." This represents internalized learning and is directly tied to leadership team development goals.
Lagging Indicators: What Changes Over Time
Lagging indicators are performance outcomes that take six to twelve months to materialize. They carry more organizational weight than leading indicators because they connect to business results, but they are harder to attribute to coaching alone. Every lagging indicator comes with a built-in attribution caveat.
Team retention and employee engagement scores. Retention is a lagging signal of team health. Track voluntary turnover within the coached team over a 12-month window. Compare against the organizational baseline. Employee engagement scores, measured through pulse surveys or 360-degree feedback instruments, provide a more granular view. The caveat: retention is influenced by compensation, market conditions, and management changes that have nothing to do with coaching.
Delivery metrics. For software and product teams, throughput, cycle time, and quality indicators are the natural measurement framework. These teams already track delivery data, which makes before-and-after comparison straightforward. The caveat: delivery improvements may coincide with tooling changes, process redesigns, or team composition shifts that coaching did not cause.
Strategic execution rate. For executive and leadership teams, the key performance indicator is what percentage of strategic decisions reach implementation within 90 days. Leadership teams that make decisions but fail to execute them are a common pattern. Coaching improves the connective tissue between decision and action. Track quarterly: decisions made versus decisions implemented.
Stakeholder satisfaction. Internal and external customer feedback, collected through structured surveys, provides an outside-in view of team effectiveness. This metric captures downstream organizational impact that team-level metrics alone may miss. Ask stakeholders the same three questions before and after the engagement to create a comparable baseline.
Revenue and cost impact. The metric organizations want most and the one hardest to attribute honestly. Some engagements produce traceable financial outcomes: reduced project overruns, decreased recruitment costs from improved retention, measurable productivity gains. In most cases, financial impact is real but shared across multiple concurrent initiatives.

What You Cannot Measure
Some of the most valuable outcomes of team coaching resist quantification entirely. Saying so strengthens the business case, because it is the position a coaching provider or organizational buyer can defend when the numbers are audited.
Quality of team conversations. Observable but not quantifiable. A team coach can see the difference between a conversation where people are genuinely thinking together and one where they are performing collaboration. An observer can describe it. A survey cannot capture it. The shift from performative to genuine dialogue is one of the first things coaches notice, and it has no metric.
Capacity to handle future challenges. Coaching builds capability that only becomes visible when a new challenge arrives. A team that handled a product launch crisis effectively because of skills developed through coaching six months earlier cannot attribute that response to a line item in the coaching budget. The value is real. It is also invisible until the moment it matters.
Cascading cultural influence. How one coached team influences adjacent teams through changed norms, better communication patterns, and modeled behavior. This organizational culture change is among the intangible benefits most valued by senior leaders, but the attribution chain is too long and too diffuse to measure.
A software team broke their work into smaller pieces and saw delivery improve. Months later, they decided to revert to larger work items. Within two weeks, they recognized it was not working and recommitted voluntarily. The coach did not fight their decision or say "I told you so." That full cycle of experiment, success, reversion, failure, and recommitment with genuine conviction is the deepest value coaching produces. It resists every measurement framework.
Requiring hard ROI proof before investing in team coaching may itself reflect the measurement-obsessed organizational culture that coaching is designed to surface and challenge. Organizational buyers should sit with that tension before defaulting to “prove it first.”
Building a Measurement Framework
A practical coaching ROI framework does not eliminate uncertainty. It structures the conversation around what can be observed, what can be tracked, and what must remain qualitative.
The following five steps work for both software delivery teams and executive leadership teams, though the specific metrics differ by team type. Coaches building fluency with executive-team metrics specifically can start with the Practitioner Series systemic coaching course.
- Baseline before coaching. Capture the current state of both leading indicators (decision velocity, decision quality, meeting effectiveness, participation balance) and lagging indicators (retention, engagement scores, delivery throughput or strategic execution rate). Without a baseline, post-engagement claims about improvement are anecdotal.
- Define “enough.” Before the engagement begins, agree with the sponsor on what improvement justifies the team coaching investment. Not "maximum possible improvement" but "what would make this worthwhile." Setting this threshold in advance prevents moving goalposts and gives both parties a shared reference point.
- Track leading indicators monthly. Behavioral changes are the earliest evidence. Decision velocity, decision quality (from the decision log), participation balance, and conflict surfacing can be assessed in monthly check-ins without formal surveys. These provide the feedback loop that keeps the coaching engagement responsive.
- Track lagging indicators quarterly. Performance outcomes need longer cycles. Use existing organizational instruments: employee engagement scores, delivery metrics, stakeholder satisfaction surveys, and 360-degree feedback. Do not create new measurement tools for coaching. Use what the organization already tracks and compare against baseline.
- Retrospective at engagement end. Conduct this with the team, not just the sponsor. Teams observe changes that sponsors miss because sponsors observe from outside the room. Structure the retrospective around three questions: what changed, what did not change, and what changed that was not expected. This captures measurable business outcomes alongside qualitative shifts.

Defining “enough” before the engagement starts is the step most organizations skip. Its absence is what makes post-engagement ROI discussions feel arbitrary. When both parties agree on what improvement justifies the investment, the measurement conversation shifts from proving value to tracking progress.
Three measurement levels provide a quality hierarchy for the data collected. Satisfaction data (post-engagement surveys) is the weakest: it measures comfort, not impact. Behavioral change data (leading indicators tracked over time) is stronger and directly observable. Performance outcome data (lagging indicators with baseline comparison) is the strongest but carries the heaviest attribution burden. Most organizations collect the weakest level and skip the other two. A meaningful framework requires all three, and it requires embedding coaching systemically enough that measurement becomes part of the engagement design, not an afterthought.
A Team Coaching Measurement Scorecard
This scorecard puts the indicators above on one sheet. Agree it with the sponsor before the first session and use it as the baseline in step one of the framework.
Need a Measurement Framework for Your Team?
Tandem’s coaches build baseline-to-retrospective measurement into every engagement, tracking leading and lagging indicators on the timelines that matter.
| Indicator | What to look for | Cadence | Data source | Attribution caveat |
|---|---|---|---|---|
| Decision velocity | Decisions resolved in the meeting where they surface | Monthly | Meeting notes or decision log | A new leader or a market shift can change pace too |
| Decision quality | Options, dissent and an owner on the table before commitment; decisions that hold | Monthly | Decision log | A judgment the team makes about its own decisions |
| Meeting effectiveness | Decisions made versus decisions that hold across two weeks | Monthly | Decision log | Fewer, easier decisions can flatter it |
| Participation balance | Meaningful contribution from members who used to stay silent | Monthly | Observation by the coach and the team | Equal airtime is not the goal |
| Conflict surfacing | Disagreement named in the room instead of resisted afterward | Monthly | Observation by the coach and the team | Can look like rising conflict to sponsors |
| Self-regulation | The team names its own patterns without the coach prompting | Monthly | Team check-ins and retrospective | Hard to attribute when membership changes |
| Retention and engagement | Voluntary turnover over 12 months; engagement or 360-degree scores against baseline | Quarterly | HR systems and pulse surveys | Compensation, market and management changes |
| Delivery metrics | Throughput, cycle time and quality | Quarterly | Existing delivery tools | Tooling, process and team composition changes |
| Strategic execution rate | Share of strategic decisions implemented within 90 days | Quarterly | Leadership team decision log | Concurrent initiatives share the credit |
| Stakeholder satisfaction | The same three questions asked before and after | Start and end | Structured survey | Reflects work beyond the coached team |
| Revenue and cost impact | Project overruns, recruitment costs, productivity | Quarterly | Finance reporting | Real but shared across initiatives |
The organization supplies the lagging data from instruments it already runs. The team keeps the decision log, because noticing its own patterns is part of what coaching builds. In our coaching work, the measures are agreed with the client at the start and taken again at the end, with a midpoint check on longer engagements, so the scorecard is the reference for every review.
The Satisfaction Data Trap
Post-engagement satisfaction surveys are the most commonly collected coaching metric and the least meaningful. They measure whether the team had a comfortable experience, not whether the coaching produced results.
Teams that were genuinely challenged by coaching, pushed to confront avoidance patterns, name unproductive dynamics, and change established habits, may rate the experience lower than teams that had pleasant but inconsequential sessions. The strongest coaching engagements often produce discomfort in the moment and value over time. A satisfaction survey captures the discomfort and misses the value.
Organizations that rely on satisfaction scores as their primary coaching metric will systematically favor coaches who prioritize comfort over effectiveness. If satisfaction data is the only measurement collected, it should be weighted accordingly: useful as a data point, insufficient as an evaluation.
The measurement approach matters more than the ROI statistic. A provider that names what it can and cannot prove is more trustworthy than one citing 7x returns from a methodology that does not apply. Start with a baseline, track leading indicators monthly, lagging indicators quarterly, and conduct the retrospective with the team.
Tandem Coaching publishes its measurement framework because honest measurement is how organizations make informed decisions about team coaching services.
Team Coaching ROI: Common Questions
What is the ROI of coaching, and do the 788% and 7x figures apply to teams?
The widely quoted coaching ROI figures come from individual coaching: a 2001 MetrixGlobal case study at one company (529% without retention benefits, 788% with them) and the 2009 ICF Global Coaching Client Study (a median of seven times the investment, reported by companies). Both rest on participants’ own estimates, and neither measured team coaching, so neither works as a team coaching return.
How long does team coaching take to show results?
Leading indicators such as decision velocity, decision quality and participation balance change within weeks and can be reviewed monthly. Lagging indicators such as retention, engagement scores, delivery metrics and strategic execution rate take six to twelve months and are reviewed quarterly against the baseline captured before the engagement.
What is decision quality, and how do you track it?
Decision quality judges how a decision was made: whether the problem was framed, alternatives compared, information gaps named, trade-offs stated, dissent heard and an owner agreed before the team committed. A team tracks it with a decision log reviewed monthly, counting which decisions held and noting why any were reopened.
Can you calculate a percentage ROI for team coaching?
Only with an attribution assumption agreed in advance. In our coaching work, that conversation happens at the start: what result the organization wants, what it would be worth, how likely it was without coaching, and what share to credit to coaching, since the effect on the bottom line is indirect. Many outcomes stay intangible, and some results only show up at the end.
Who should collect the measurement data?
Split it by data type. The organization supplies lagging data from instruments it already runs, the team keeps its own decision log, the sponsor agrees what improvement counts as enough, and the coach designs the measurement with them and runs the reviews. Keeping the data with the team and the organization means the evidence does not depend on the coach’s own report.
Ready to Measure What Matters?
Book a free consultation to discuss your team coaching goals, measurement approach, and how Tandem builds accountability into every engagement.
Book a Free Consultation →