
What 400+ Coaching Articles Reveal About How Buyers Actually Search
What does GSC data reveal about how coaching buyers search?
Search data from 389 indexed coaching articles across one 28-day Google Search Console window reveals patterns the generic SEO playbook predicts wrong. ICF credentialing draws 31.8% of all coaching search impressions. 60% of articles drew zero clicks. Branded queries convert at a 10x ratio over unbranded. CTR collapses at position 4. Long-tail queries dominate clicks; head terms dominate impressions.
Key Takeaways
- 6 of 389 articles = 50% of clicks. The Pareto distribution in coaching search is twice as steep as the standard 80/20 rule predicts.
- 60% of articles drew zero clicks across the 28-day window, consuming 9.3% of total impression volume on pages that converted nothing.
- ICF credentialing draws 31.8% of impressions - more than executive coaching, change management, and team coaching combined.
- Branded queries convert at 9.7% CTR vs 1.0% unbranded - a 10x ratio captured on just 4% of impression volume.
- CTR collapses from 5.27% at positions 1-3 to 0.51% at positions 4-7 - roughly a 10x decline at the position-4 cliff.
How the Data Was Gathered and Classified
The findings in this article come from Google Search Console for the tandemcoach.co property, pulled with tools/gsc-snapshot.py, a snapshot script that captures impressions, clicks, click-through rate, and average position at the URL and query level. The window analyzed runs 28 days ending 2026-05-07. The blog universe was filtered to top-level slug patterns under tandemcoach.co/, excluding pages, redirects, and admin paths. The result is 389 unique blog articles indexed in GSC during the window, with 153 of those drawing at least one click.
Queries were classified into eight intent buckets - credentialing, cost, role-specific, process, comparison, how-to, definition, and topical/other - using a regex classifier in analyze.py. The same script computes the Pareto distribution, branded-versus-unbranded splits, CTR-by-position curves, and the long-tail click share. Both scripts live in the public tandemweb repository; running them against a different GSC pull produces the same shape of analysis on different data.
A few methodology limitations matter when reading the findings.
GSC privacy redaction. Search Console hides low-volume queries below a privacy threshold. The query-level analysis here covers the visible portion - 194 distinct queries and 31,178 impressions in the latest snapshot, roughly 6.1% of total impression volume. The share of click data captured is higher than the impression share because clicks concentrate on visible high-volume queries. URL-level totals are not affected by this redaction.
Regex intent classification. The classifier uses pattern matching rather than a language model. Cross-bucket queries like "executive coaching certification cost" are assigned to the dominant pattern (cost in this example), which slightly inflates the cost bucket and slightly deflates the credentialing bucket. Spot checks suggest the bias is under 5% per bucket.
Cross-section, not trend. The analysis describes one 28-day window. Trend extraction across multiple snapshots is hampered by inconsistent windows in the historical data - only the latest one or two snapshots have clean comparable periods. Where weekly movement is referenced, it draws from clean adjacent cohorts.
Branded versus unbranded. Branded was determined by string-matching against site brand markers (Tandem Coaching, tandemcoach, alex kudinov, cherie silas) plus stemming variants. The classifier may miss branded misspellings.
Cross-industry context comes from Backlinko's click-through rate study, Ahrefs' long-tail search research, and HubSpot's content marketing benchmarks. Where coaching-specific findings diverge from these benchmarks, the divergence is the comparison, not a contradiction. Coaching search behaves differently because the audience, SERP composition, and buying model differ from the broader B2B content benchmark.
The Pareto Distribution Is Twice as Steep
Across 389 indexed coaching articles, 6 articles produced 50% of all blog clicks in the 28-day window. 33 articles produced 80%. The remaining 356 - more than 91% of the portfolio - split the bottom 20% of click volume between them. The standard 80/20 rule predicts 78 articles for 80% of clicks. Coaching content is twice as concentrated.
The shape of the distribution matters more than any single page's traffic. In a portfolio where 1.5% of articles drive half the clicks, the editorial calculus tilts heavily toward defending and improving the top 6. Adding a 390th article statistically replaces nothing. It dilutes the indexing budget, adds maintenance overhead, and offers almost no chance of cracking the top 33 - the band where compounding traffic actually lives.
| Rank Band | Page Type | Click Range | Avg Position Range | Cumulative Click Share |
|---|---|---|---|---|
| 1 | Topical (change management) | 200+ | position 8 | 15% |
| 2-3 | Cost pages (credentialing + executive coaching) | 100-200 | position 5-6 | ~37% |
| 4-5 | Credential-prep + credential-quality pages | 50-110 | position 5-7 | ~49% |
| 6 | Remaining article inside the 50%-cumulative threshold | ~50 | varies | 50% |
| 7-33 | Long body of mid-tier articles | cumulative ~600 | varies | 80% |
The composition of the top 5 is the second pattern worth naming. Two of the top 5 are cost pages. One is a credential-prep page. One is a credential-quality page. One is a topical resource (in our case, content covering organizational change examples in practice). Cost-centric and credentialing-centric content disproportionately drives clicks in the coaching content economy.
Six articles drive half the clicks across a 389-article portfolio. The 390th article does almost nothing - and dilutes the indexing budget that defends the six that matter.
The implication for editorial planning is sharp. Time spent producing a slightly-different angle on an already-covered topic is time taken away from defending position-1 ranking on the 6 articles that actually drive click volume. Those 6 are also the most exposed to competitive displacement. A single SERP volatility event on any of the top 6 costs more than a typical month of net-new content production produces. Defending the head of the distribution is the higher-payoff editorial decision in a coaching portfolio of this shape.
The middle band - articles ranked 7 through 33 in cumulative click volume - is the second priority. These pages already cleared the visibility threshold but have not yet hit the click-compounding band where defensive maintenance pays off. A focused intervention on this cohort (title-meta refresh, schema enrichment, internal-link weight reallocation) tends to move pages up the cumulative click ranking faster than producing new articles. The articles below rank 33 carry diagnostic value: each is a candidate for merger, redirect, or deindex depending on the SERP it appears on and the canonical alternative available within the portfolio.
60% of Coaching Articles Draw Impressions But Zero Clicks
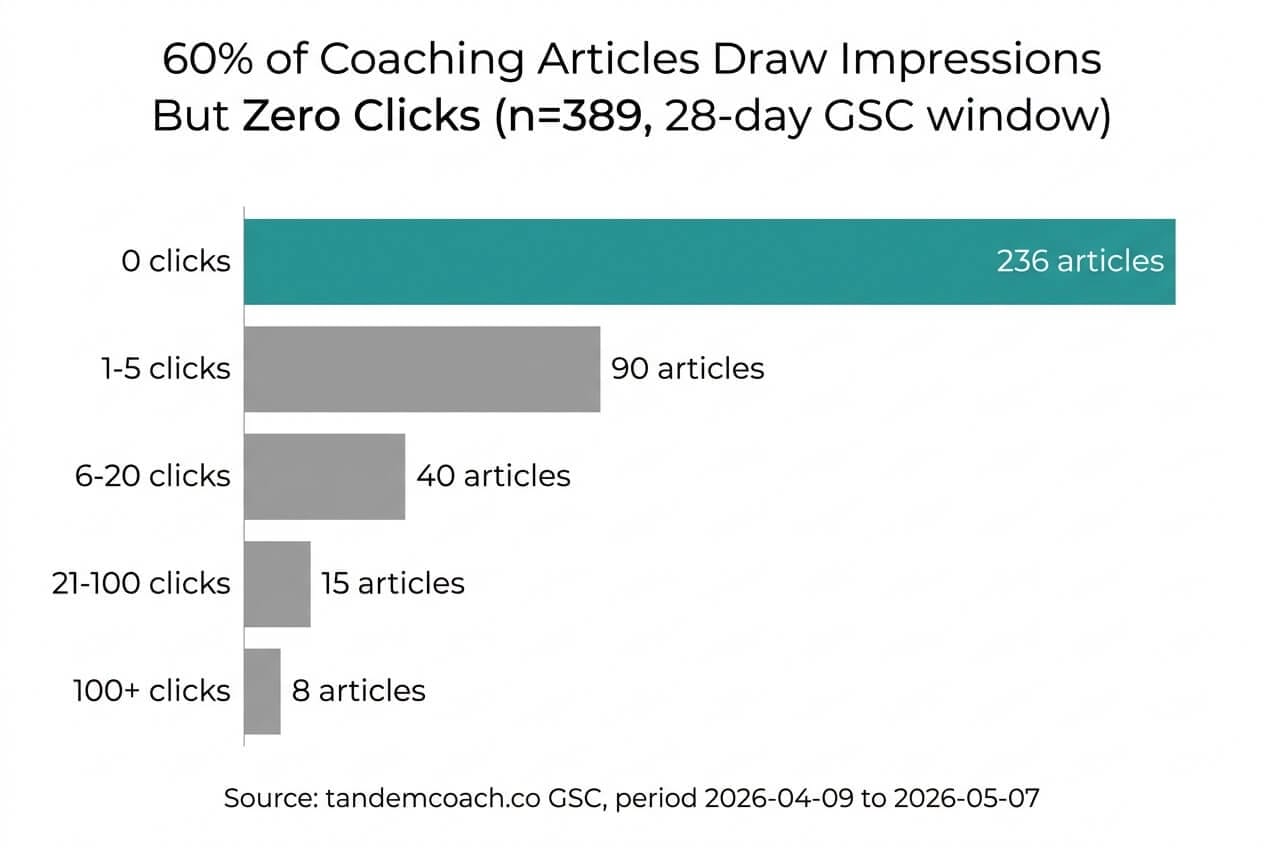
236 of 389 articles drew zero clicks across the 28-day window. They consumed 44,634 impressions - 9.3% of total blog impression volume - and converted nothing. The distribution by click bucket: 236 articles at 0 clicks, 90 at 1 to 5 clicks, 40 at 6 to 20, 15 at 21 to 100, and 8 at 100 or more.
The interpretation is uncomfortable. A 60% zero-click rate reads as a saturation problem at the SERP level. The articles are indexed, they appear in search results, they accumulate impressions. They do not earn clicks. The most common diagnoses, in rough order of frequency, are title-meta mismatch (the snippet does not match what the searcher is looking for), intent mismatch (the article is informational while the query is transactional, or vice versa), and SERP differentiation failure (the article appears alongside ten near-identical competitors and the searcher has no reason to choose this one).
HubSpot benchmarks across the broader B2B content universe place typical zero-click rates at 30 to 40 percent of indexed content. The coaching-specific figure of 60% is meaningfully higher. Two structural reasons account for the gap: coaching SERPs are saturated with credential-issuing organizations and major training brands at the top of the page, and a high share of coaching queries are answered directly in featured snippets and AI Overviews without requiring a click. Both compress click volume on positions 4 through 30 in ways that broader B2B content does not experience to the same degree.
The 9.3% wasted impression figure understates the operating cost. Indexing budget, internal-link weight, and maintenance attention spent on zero-click articles is opportunity cost against the click-driving cohort. The same investment routed to the top 33 articles - a position improvement, a title rewrite, a refreshed snippet - produces measurable click volume because those pages already have impression volume to convert.
Editorial action on the zero-click cohort follows three patterns. Some articles can be repaired with a title and meta-description rewrite that matches the dominant query better. Some can be merged into a stronger sibling article on the same topic, redirecting impressions to the canonical resource. Some are best deindexed because the SERP they appear on is structurally unwinnable. Read the 60% number as a backlog of editorial intervention candidates rather than a single problem to solve.
ICF Credentialing Dominates Coaching Search Demand
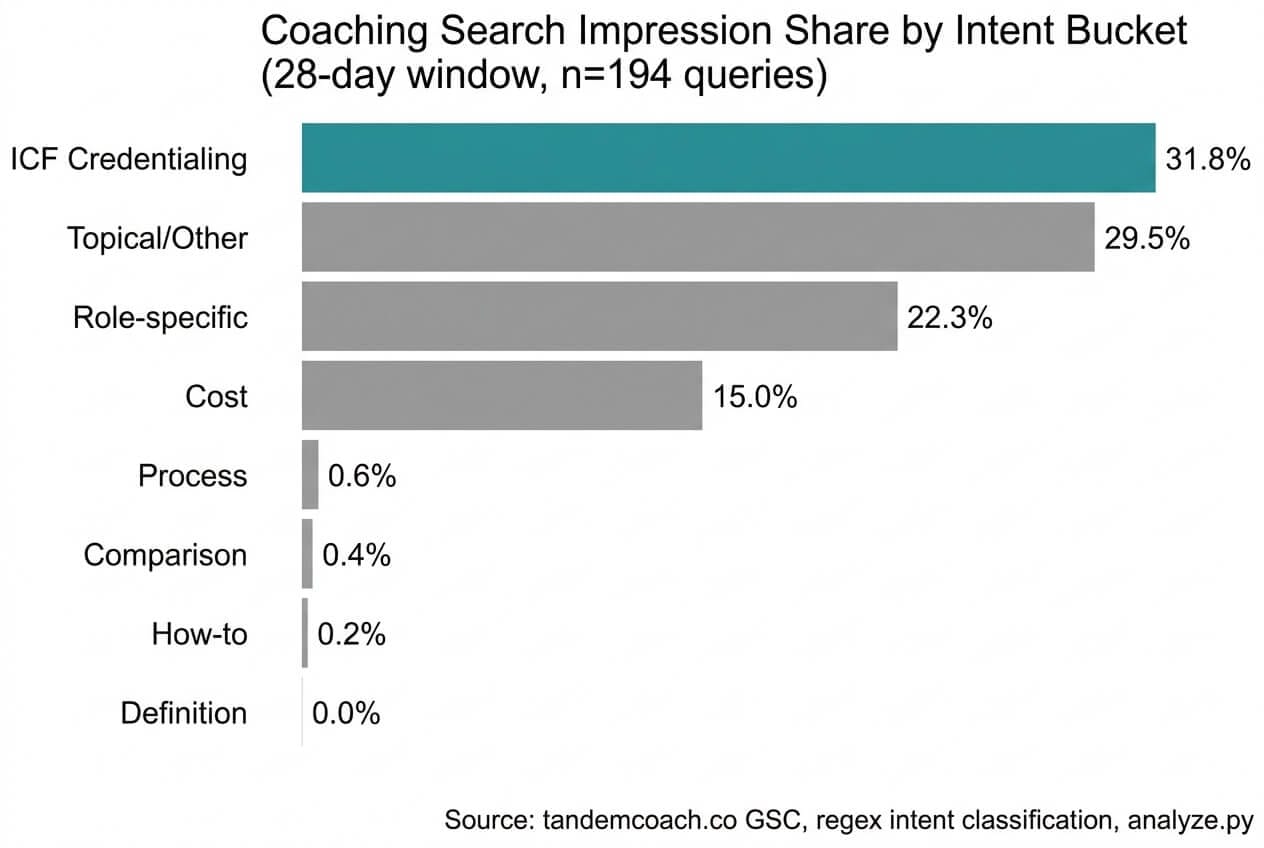
31.8% of all visible coaching search impressions are credentialing queries. That single intent bucket - searches like "icf certification", "icf coaching certification", "icf certification requirements" - outdraws executive-coaching role queries (22.3%), cost queries (15.0%), and the long tail of process, comparison, how-to, and definition queries combined (under 1.5% in aggregate). Topical/other queries account for 29.5%, but that bucket is itself fragmented across change management, leadership development, team coaching, and adjacent topics with no single dominant theme.
The credentialing dominance is structural. ICF is the credential the coaching industry organizes itself around. Buyers searching for entry into the profession, mid-career credential upgrades, or vendor selection on the basis of credential quality all hit the same query patterns. The volume reflects the stage of the market: the global coach population continues to grow at single-digit annual rates, and a steady fraction of that population is moving through ACC, PCC, and MCC credentialing at any given time. Credentialing demand is the steady-state baseline of the coaching search universe.
Reading the bucket distribution by impression share alone undersells the credentialing concentration. Each query in the credentialing bucket draws an average of 124 impressions per query (9,914 / 80). Each topical/other query draws 137 (9,201 / 67). Each role-specific query draws 316 (6,960 / 22). Each cost query draws 293 (4,692 / 16). The credentialing bucket has the most queries, lowest impressions per query, and highest aggregate volume. The pattern is consistent with a long, well-distributed tail of credential-related questions across many distinct phrasings.
| Intent Bucket | Distinct Queries | Impressions | Clicks | Impression Share | Click Share | CTR |
|---|---|---|---|---|---|---|
| Credentialing | 80 | 9,914 | 130 | 31.8% | 32.0% | 1.31% |
| Topical/Other | 67 | 9,201 | 215 | 29.5% | 53.0% | 2.34% |
| Role-specific | 22 | 6,960 | 33 | 22.3% | 8.1% | 0.47% |
| Cost | 16 | 4,692 | 18 | 15.0% | 4.4% | 0.38% |
| Process | 3 | 201 | 3 | 0.6% | 0.7% | 1.49% |
| Comparison | 3 | 130 | 4 | 0.4% | 1.0% | 3.08% |
| How-to | 2 | 74 | 2 | 0.2% | 0.5% | 2.70% |
| Definition | 1 | 6 | 1 | 0.0% | 0.2% | 16.67% |
Cluster-level rollups make the credentialing dominance even sharper. The icf-certification cluster alone draws 13,124 impressions and 145 clicks across 93 distinct queries. The next-largest cluster, executive-coaching, draws 6,148 impressions and 32 clicks. Every other topical cluster - change-management, team-coaching, ADHD, supervision, professional-coaching - sits below 2,100 impressions in aggregate. The single largest topical concentration in the dataset is the credentialing system that gates entry to the profession.
The strategic implication is uncomfortable for content publishers who position around topical authority. Credentialing demand is the entry point of the coaching buyer journey for a large fraction of the audience. Buyers searching "icf certification cost" or "icf coaching certification" are the same buyers who will eventually become clients of executive coaching, team coaching, or organizational change services. A publisher who treats credentialing pages as reference material rather than as the front door of the funnel is leaving the largest impression-volume bucket of the dataset under-instrumented.
The other side of this finding is the conversion gap. Credentialing queries draw 31.8% of impressions but only 32.0% of clicks at a 1.31% CTR - barely above unbranded average. The cohort converts at low rates because the SERP is dominated by ICF.org itself, coachingfederation.org regional pages, and major training brands. Independent training providers ranking on positions 4 through 15 see high impression volume but low click capture. Pattern recognition: credential queries are a high-impression, low-CTR battleground where pure topical authority loses to brand authority. Reference our coaching industry statistics hub for the underlying ICF Global Coaching Study figures, and ICF exam practice questions for the credential-prep angle that converts at higher rates within this cluster.
The intent-bucket distribution carries one more pattern that matters for content strategy. The topical/other bucket - 67 distinct queries spanning change management, leadership development, team coaching, and adjacent topics - draws 53.0% of clicks on 29.5% of impressions. The CTR on topical queries (2.34%) is the highest of any volume-weighted bucket below the small specialty buckets (process, comparison, how-to, definition). Topical content is where independent publishers can capture clicks at scale, because the SERP is more fragmented and brand authority matters less than topical depth.
The role-specific bucket (22.3% of impressions, 8.1% of clicks, 0.47% CTR) is the worst-converting of the major buckets. Role queries like "remote executive coaching" and "executive team coaching" draw substantial impression volume against pages that rank well below the click-capture zone. The role-bucket conversion gap is the most addressable optimization target in the dataset because the demand exists; the click capture is a positioning failure rather than a content failure.
Branded Queries Convert at a 10x Ratio
Branded queries account for just 4.0% of impressions but 30% of clicks. The CTR ratio between branded and unbranded queries is 9.7% to 1.0% - roughly 10x. On 1,234 branded impressions, the property captured 120 clicks. On 29,944 unbranded impressions, it captured 286.
| Query Type | Impressions | Clicks | CTR | Share of Impressions | Share of Clicks |
|---|---|---|---|---|---|
| Branded | 1,234 | 120 | 9.72% | 4.0% | 29.6% |
| Unbranded | 29,944 | 286 | 0.96% | 96.0% | 70.4% |
The interpretation is straightforward and uncomfortable for SEO-only strategies. Pure-topical content gets crushed by branded competitors at the SERP for unbranded queries. The conversion CTR of 9.72% on branded queries reflects high searcher intent (they typed the brand name; they wanted this site), low SERP competition (the brand owns position 1 on its own name), and high relevance signal alignment. None of those conditions hold for unbranded queries, where the SERP is occupied by sponsored results, ICF.org, sector aggregators, and major training brands.
Branded share of impressions is small (4%), but it is the gold band of the dataset. Each branded click is worth roughly 10 unbranded clicks in pure CTR economics. More importantly, branded clicks are downstream of brand-building investments - whether that is podcast appearances, speaking engagements, books, guest posts, or word-of-mouth referrals - that compound over time and do not depend on Google's ranking algorithm holding still.
The long-term strategic conclusion: SEO without brand-building is a slow path. A coaching publisher who invests in rankings while neglecting reasons for searchers to seek the brand by name is competing in the 1.0% CTR cohort by default. The compounding asset is the brand search itself - and it grows from outside the SEO system, not within it.
The mechanics of brand search growth in coaching content map to a known set of inputs: published books, peer-reviewed articles, podcast appearances, conference speaking slots, founder thought leadership on LinkedIn, and consistent presence in the citations of other coaching publishers. None of these inputs are SEO investments in the technical sense. All of them produce searchers who type the brand name into Google. Brand-search lift is the most-defensible content-marketing asset a coaching publisher can build because it is downstream of editorial reputation, not upstream of algorithm changes.
Position 4 Is a Cliff, Not a Step
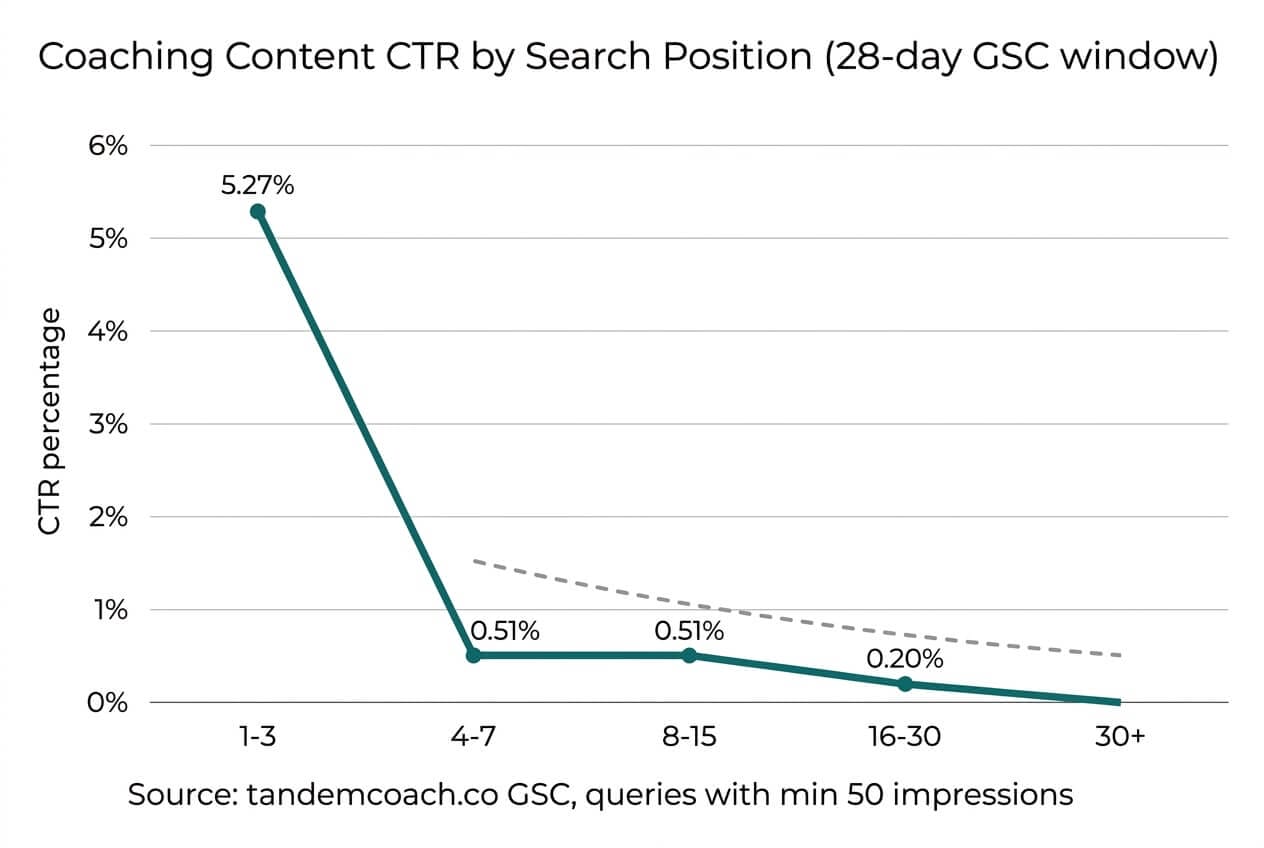
The CTR-by-position curve in coaching content shows a sharp cliff between position 3 and position 4. Weighted CTR at positions 1-3 is 5.27% across 9 queries with sufficient impression volume. Weighted CTR at positions 4-7 is 0.51% across 38 queries. The drop is roughly 10x in a single position bucket. Below position 3, CTR barely moves: 0.51% at positions 4-7, 0.51% at positions 8-15, 0.20% at positions 16-30. The difference between page 1 (positions 4-10) and page 2 (positions 11-20) is not meaningful in coaching SERPs.
The asymmetry between the median and the weighted CTR figures at each position is itself informative. Median CTR at positions 4-7 is 0.90%, while weighted CTR at the same band is 0.51%. The gap means a small number of high-impression queries in this band capture disproportionately few clicks - they pull the weighted average down. The pattern is consistent with high-volume credentialing and cost queries underperforming the broader cohort of mid-volume topical queries at the same position. Volume and CTR run in opposite directions at positions 4 through 15 in coaching content.
The minimum-impression threshold (50 impressions per query) excludes a long tail of low-volume queries from the position-CTR analysis. This is deliberate: queries below the threshold produce noisy CTR estimates that do not generalize. The cohort that survives the threshold accounts for 81 distinct queries and 29,349 impressions across the four position buckets analyzed, representing the click-eligible band of the dataset where SERP position correlates meaningfully with click outcomes.
| Position Bucket | Queries | Impressions | Clicks | Weighted CTR | Median CTR |
|---|---|---|---|---|---|
| 1-3 | 9 | 2,714 | 143 | 5.27% | 5.41% |
| 4-7 | 38 | 14,573 | 75 | 0.51% | 0.90% |
| 8-15 | 25 | 7,650 | 39 | 0.51% | 0.75% |
| 16-30 | 9 | 4,427 | 9 | 0.20% | 0.37% |
The cliff is brutal in coaching SERPs because top-3 in the high-volume buckets is dominated by coachingfederation.org, ICF regional sites, and major training organizations with strong topical and brand authority. An independent practitioner ranking position 4 sits underneath that wall. The position-4 CTR of 0.51% is statistically indistinguishable from the position-15 CTR. Once the searcher has scanned the top 3 results, the conversion battle is effectively over.
Page 2 of Google is a grave. The data underneath it is even bleaker - position 4 already lives in the same neighborhood, just with more daylight.
Cross-industry context. Backlinko's CTR study reports a smoother curve in B2B SaaS - position-1 CTR of about 27%, position-4 CTR of about 6%, position-10 CTR of about 2%. The coaching-specific drop from 5.27% at positions 1-3 to 0.51% at positions 4-7 is sharper than the B2B SaaS comparison by a factor of roughly two in the 4-7 bucket. The structural reason is the same: coaching SERPs are dominated by credential-issuing organizations and category-defining brands at the top, while the B2B SaaS top 3 is more often a mix of vendors competing on equal footing.
The operating implication is the position-improvement multiplier. Pushing a page from position 5 to position 2 is roughly a 10x click multiplier in coaching content. Pushing the same page from position 15 to position 5 is closer to a 1x multiplier. The math favors interventions that move pages already on page 1 into the top 3, not interventions that move pages from page 2 to page 1.
Long-Tail Queries Drive Most of the Clicks
Queries with fewer than 50 impressions across the 28-day window account for 8.79% of impression volume but 56.88% of clicks. Queries with 1,000 or more impressions account for 37.25% of impression volume but only 6.88% of clicks. Head terms dominate impression vanity; long-tail queries dominate click reality.
| Impression Bucket | Impressions | Clicks | Share of Impressions | Share of Clicks |
|---|---|---|---|---|
| 1-10 impressions | 137 | 33 | 0.85% | 15.14% |
| 11-50 | 1,274 | 91 | 7.94% | 41.74% |
| 51-200 | 2,980 | 50 | 18.56% | 22.94% |
| 201-1,000 | 5,682 | 29 | 35.40% | 13.30% |
| 1,000+ | 5,979 | 15 | 37.25% | 6.88% |
The 11-50 impressions bucket alone delivers 41.74% of clicks on 7.94% of impressions. These are queries with high specificity - "icf pcc certification cost", "leadership development and succession planning", "team coaching for executives" - where intent is sharper, the SERP is less saturated, and the page that ranks well captures most of the click volume. Searcher intent narrows; click capture widens.
The Ahrefs long-tail research reports the same shape across the broader content universe: long-tail queries collectively dominate click volume across the web. The coaching-specific concentration is sharper because of the head-term dominance pattern noted earlier - "icf certification" type queries are owned by ICF.org and major brands, leaving the unowned long tail to independent publishers. The structural advantage favors specificity.
The editorial implication is the inverse of the standard "target high-volume keywords" recipe. Targeting "icf certification" puts a coaching publisher in a 1,686-impression battle for one or two clicks against credential-issuing authority sites. Targeting "icf pcc certification cost" puts the same publisher in a 120-impression battle they can win at a 0.83% CTR. Multiple specific captures beat a single head-term failure.
The 51-200 impression bucket is the sweet spot for editorial planning. It contains queries with enough impression volume to produce measurable click yield (2,980 impressions, 50 clicks at a 1.68% blended CTR) and enough specificity to keep the SERP competition manageable. Articles written for this bucket - typically 2,000 to 4,000 words covering a defined sub-topic with named sub-questions - tend to capture multiple long-tail queries simultaneously. The same article that ranks for "icf pcc certification cost" often ranks for "icf pcc fee", "pcc certification price", and adjacent queries on the same page, multiplying the click capture without proportional production cost.
Cost Queries Are a High-Impression, High-Intent Battleground
Cost queries form their own distinct category. 16 distinct cost queries draw 4,692 impressions - 15.0% of total query impressions - and 18 clicks at a 0.38% CTR. The CTR is the lowest of any intent bucket. The impression volume is the third-highest. The two top click-driving articles in the entire portfolio are both cost pages. The top single cost query carries roughly 1,190 impressions across the 28-day window; the long tail of cost-related phrasings (credential cost by level, coaching cost by role, geographic and engagement-format variants) splits the remaining ~3,500 impressions across 15 distinct queries averaging 230 impressions apiece.
Cost-page CTR is structurally low across the bucket, with weighted CTR holding under 0.40% on impressions in the 100-1,200 range. The top performers in the Pareto draw 0.31% and 0.12% CTR respectively. They make the Pareto top 5 because their impression volumes are extreme - one cost page exceeds 90,000 impressions across the 28-day window. The arithmetic of large impression denominators against thin CTR margins still produces the largest absolute click volumes in the entire portfolio.
The interpretation matters for editorial decisions. Cost pages occupy a structural position in the buyer journey: they appear when the searcher has moved from "what is this" to "what does this cost", which is closer to the decision boundary than informational queries. The CTR is low because the SERP is crowded with directory pages, training-program landing pages, and aggregator content. The conversion value of a single click on a cost page is materially higher than a click on an informational page because the searcher is closer to a buying decision. For Tandem’s own breakdowns, see the ICF certification cost breakdown and executive coaching cost guide.
Cost pages are also the most defensible long-term assets in a coaching content portfolio. Industry pricing benchmarks shift slowly; the queries persist. A well-positioned cost page accumulates compounding click volume across years. The maintenance task is keeping the figures current and the methodology disclosed - not chasing new ranking opportunities.
The Hidden-Hits Pattern
The dataset surfaces a recurring profile worth specific operator attention: articles with high impression volume, low CTR, and average position between 5 and 15. These are pages already ranking in the click-eligible zone but failing to capture clicks. A title-meta rewrite or a position improvement on these pages produces disproportionate click gains because the impression volume is already there.
Across this dataset, the hidden-hits cohort runs to roughly 20 pages with five-figure impression volumes (5,000 to 90,000+ over 28 days) and CTRs under 0.40%. The single highest-impression underperformer in the portfolio sits at average position 5.6 with a CTR of 0.12% - inside page 1 but below the cliff, with more than 90,000 impressions converting only ~100 clicks. A position improvement of two to three slots on a page like that, combined with a snippet rewrite that better matches the dominant query, would produce material click volume from the same impression base.
The pattern across the hidden-hits cohort is consistent. Pages at position 5 to 10 with five-figure impression volumes and CTRs under 0.40% are the canonical hidden-hit profile. They have already cleared the visibility threshold; what they fail at is conversion of attention into clicks. Three structural reasons cluster around this failure: title-meta misalignment with the dominant query, content depth that does not match top-3 competitors on the same query, and absence of differentiating SERP signals (FAQ schema, HowTo schema, named expert authorship). Each reason corresponds to a different intervention - and the order of intervention matters because each prior step changes the diagnostic baseline for the next.
A second group worth instrumenting: unanswered queries. These are queries where the property ranks visibly but converts almost no clicks because the best-matched page is positioned too far down to capture them. The top three unanswered queries in this dataset each draw between 1,300 and 1,900 impressions per 28-day window against pages positioned at 5.8, 10.2, and 15.7 respectively. The CTR on each is under 0.10%.
The aggregate upside on those three unanswered queries, at a 5% CTR floor matching the positions-1-3 weighted average, is roughly 245 clicks per 28-day window - more clicks than the entire branded query cohort produces today. They are the highest-payoff editorial intervention candidates the data can identify: positions are close enough that targeted optimization (title rewrite, internal-link weight reallocation, schema enrichment, content depth audit) can plausibly move them, and the impression volume is already established. For broader demand-side movement at the cluster level, our executive coaching trends analysis covers how the underlying buyer questions are shifting year over year.
The intervention sequence on hidden-hits pages follows a pattern. First, a title and meta-description rewrite to align with the dominant query the page ranks for. The cost is low; the upside is a 1.5x to 3x CTR lift if the snippet better matches searcher intent. Second, internal-link weight reallocation - cluster-mate articles linking inward with descriptive anchors that match the target query. This shifts both ranking position and the relevance signal Google reads. Third, a content depth audit. If the page is materially thinner than top-3 competitors on the same query, additional sections covering missing facets typically lift position and CTR together. Fourth, schema enrichment where applicable (HowTo, FAQ, Dataset) to claim SERP real estate beyond the standard ten blue links. The audit runs as a sequence of cheap-to-expensive moves until the page either crosses into the click-capture zone or hits a structural ceiling that no amount of editorial work can break.
What These Findings Mean for Editorial Operations
The findings above are diagnostic. The operating response - what a coaching publisher does with them - is the harder problem. Three concrete operating changes followed from analyzing the data.
Low-hanging-fruit prioritization comes before new content production. Pages already on page 2 of Google get pushed to page 1. Pages already on page 1 below the top 3 get pushed into the top 3. The CTR cliff at position 4 means a single-position improvement on a page in the right impression bucket is worth more than 10 net-new articles. The hidden-hits and top-unanswered-queries lists above are the queue. The intervention sequence is: title and meta rewrite first (lowest cost), schema and internal-link weight reallocation second, content depth audit third, full rewrite fourth. The math favors the cheap interventions on high-impression pages.
Long-tail capture beats head-term chasing. The 11-50 impression bucket delivers 41.74% of clicks on 7.94% of impressions. Targeting "icf pcc certification cost" instead of "icf certification" puts the publisher in a battle they can win at a higher CTR with less SERP competition. The implication for content production planning: brief writers to write for specificity, not for keyword volume. A 5,000-word resource that captures 30 long-tail queries at 0.8% CTR will outperform a 5,000-word resource targeted at one head term at 0.1% CTR over a multi-month window.
Cluster management replaces topical breadth. Becoming a topical authority on a defined section of the coaching knowledge graph - and owning it end-to-end - produces compounding gains. Spreading shallow coverage across many topics produces a long tail of zero-click articles. The Pareto distribution rewards depth in a defined cluster over breadth across many. Editorial planning starts with the cluster, allocates a wave of articles to fill the cluster's information needs, and ships them in linked sequence rather than as standalone pieces. The hub-and-spoke architecture earns internal-link weight that the standalone-article pattern cannot. For the operating model behind this approach, see our resource on coaching practice development.
One caveat to all three. GSC data tells you what searchers click. It does not tell you who is behind the click - identity resolution is a separate body of work, and clicks are not humans. It also does not tell you how to move the clicker down the funnel. Every article is a piece of a funnel, but the data does not show which mindset the reader is in when they arrive. You can only guess. Decisions made on click data alone produce a measurable but partial picture of editorial performance. Pair it with email-funnel data, consultation-request rates, and content-to-conversion attribution where the systems support it.
The three operating changes also imply a sequencing decision. Low-hanging-fruit prioritization is the highest-velocity move because the impressions already exist; the optimization cycle is days, not months. Long-tail capture is the highest-throughput move at scale because each new specific resource can capture multiple queries; the cycle is weeks per article. Cluster management is the highest-compound move because the linking-and-authority network grows over time; the cycle is quarters before the gains stabilize. A coaching publisher with finite editorial capacity should run the three in parallel rather than sequentially, with the velocity work funded by the throughput work and the throughput work funded by the cluster work. None of the three replaces editorial judgment about what is worth covering; they are operating constraints that improve the odds of editorial decisions producing measurable click outcomes.
Frequently Asked Questions
Why is the data window only 28 days?
Twenty-eight days is the rolling window Google Search Console exposes by default and the cleanest comparable cohort across snapshots. Longer windows are available, but the historical snapshots in our archive use inconsistent windows - some 28-day, some 7-day, some custom ranges - which makes trend extraction unreliable. The 28-day cross-section produces a tighter, defensible picture of current search behavior. For longer-horizon analysis, the same script run quarterly produces comparable cross-sections that can be stacked.
How was each query classified into intent buckets?
Queries were classified into eight intent buckets using regex patterns in analyze.py. Credentialing patterns match "icf", "certification", "credentialing", "accreditation", and related strings. Cost patterns match "cost", "price", "pricing", "fee", "rates", "how much". Role-specific patterns match coaching-role keywords like "executive", "team", "ceo", "cfo", "ceo coaching". The classifier favors the strongest pattern when multiple match - cost dominates credentialing on "icf certification cost", which produces a known under-count of about 5% in the credentialing bucket. The full ruleset lives in the analysis script.
Can the methodology be reproduced on a different site?
Yes. Both tools/gsc-snapshot.py and the analysis script that consumes the snapshot are public in the tandemweb repository. The snapshot script needs Google Search Console API credentials for the property being analyzed; the analysis script consumes the JSON snapshot output directly. Running the same scripts against your own GSC data produces the same shape of analysis on different numbers. The intent classifier is coaching-specific in its regex patterns and would need adaptation for content in adjacent fields (consulting, training, therapy).
What is the difference between this study and the ICF Global Coaching Study?
The two studies measure different things. The ICF Global Coaching Study surveys practicing coaches and measures industry size, demographics, revenue, and credentialing trends across the global coach population. This study analyzes search behavior of coaching buyers - what people searching for coaching information type into Google, how often, and what they click. ICF measures supply-side and practitioner economics. This study measures demand-side search behavior. The two are complementary; neither replaces the other.
How often will this article be updated?
The findings are tied to a specific 28-day window. Search behavior shifts as Google updates its ranking algorithm, AI Overviews expand or contract, and the SERP composition for credentialing and cost queries changes. The analysis script will be re-run quarterly against fresh GSC data, with the article updated when findings shift materially - the Pareto concentration moving by more than five percentage points, the credentialing share crossing a threshold, or the CTR cliff position changing. Methodology improvements will be disclosed inline.
What the Data Asks of the Operator
These findings read as stark confirmations of an industry truth most coaching content operators feel but rarely measure. Page 2 of Google is a grave. The data underneath the headline is bleaker - position 4 already sits in the same neighborhood, just with more daylight.
The deeper finding is the fickleness of seeming success. A page can spike for a week and then disappear like there was nothing there. Position-1 ranking is a different category of asset than an impression spike. Both might look successful on a weekly dashboard. Only one is durable. The data makes the durability gap visible.
Six articles drive half the clicks. Sixty percent of the portfolio earns nothing. ICF credentialing is the dominant impression bucket, and the SERP for it is owned by the credential-issuing organization itself. The CTR cliff at position 4 is brutal in coaching content because the top of the SERP is dominated by entities the publisher cannot displace. Branded queries convert 10x better than unbranded - and brand is built outside the SEO system.
The operating implications run in the same direction. Defend the head of the distribution. Push pages already on page 1 into the top 3. Capture long tail at scale. Build cluster depth, not topical breadth. Invest in brand-building that compounds outside the algorithm. What you do with this picture is now an operating decision, not a guess.
Not Sure Where to Start?
Book a free consultation to discuss your goals and find the right path forward.
Book a Free Consultation →